Batavia unveils interactive downtown occupancy dashboard; council asks for more data
Get AI-powered insights, summaries, and transcripts
Subscribe
Summary
City staff demonstrated a new dashboard that maps ground-floor commercial occupancy downtown and found vacancy under 11%. Councilmembers asked for additional layers — length of vacancy, prior occupant type, residential overlays and parking/land-use breakdowns — and staff said the tool will remain a live, adaptable product.
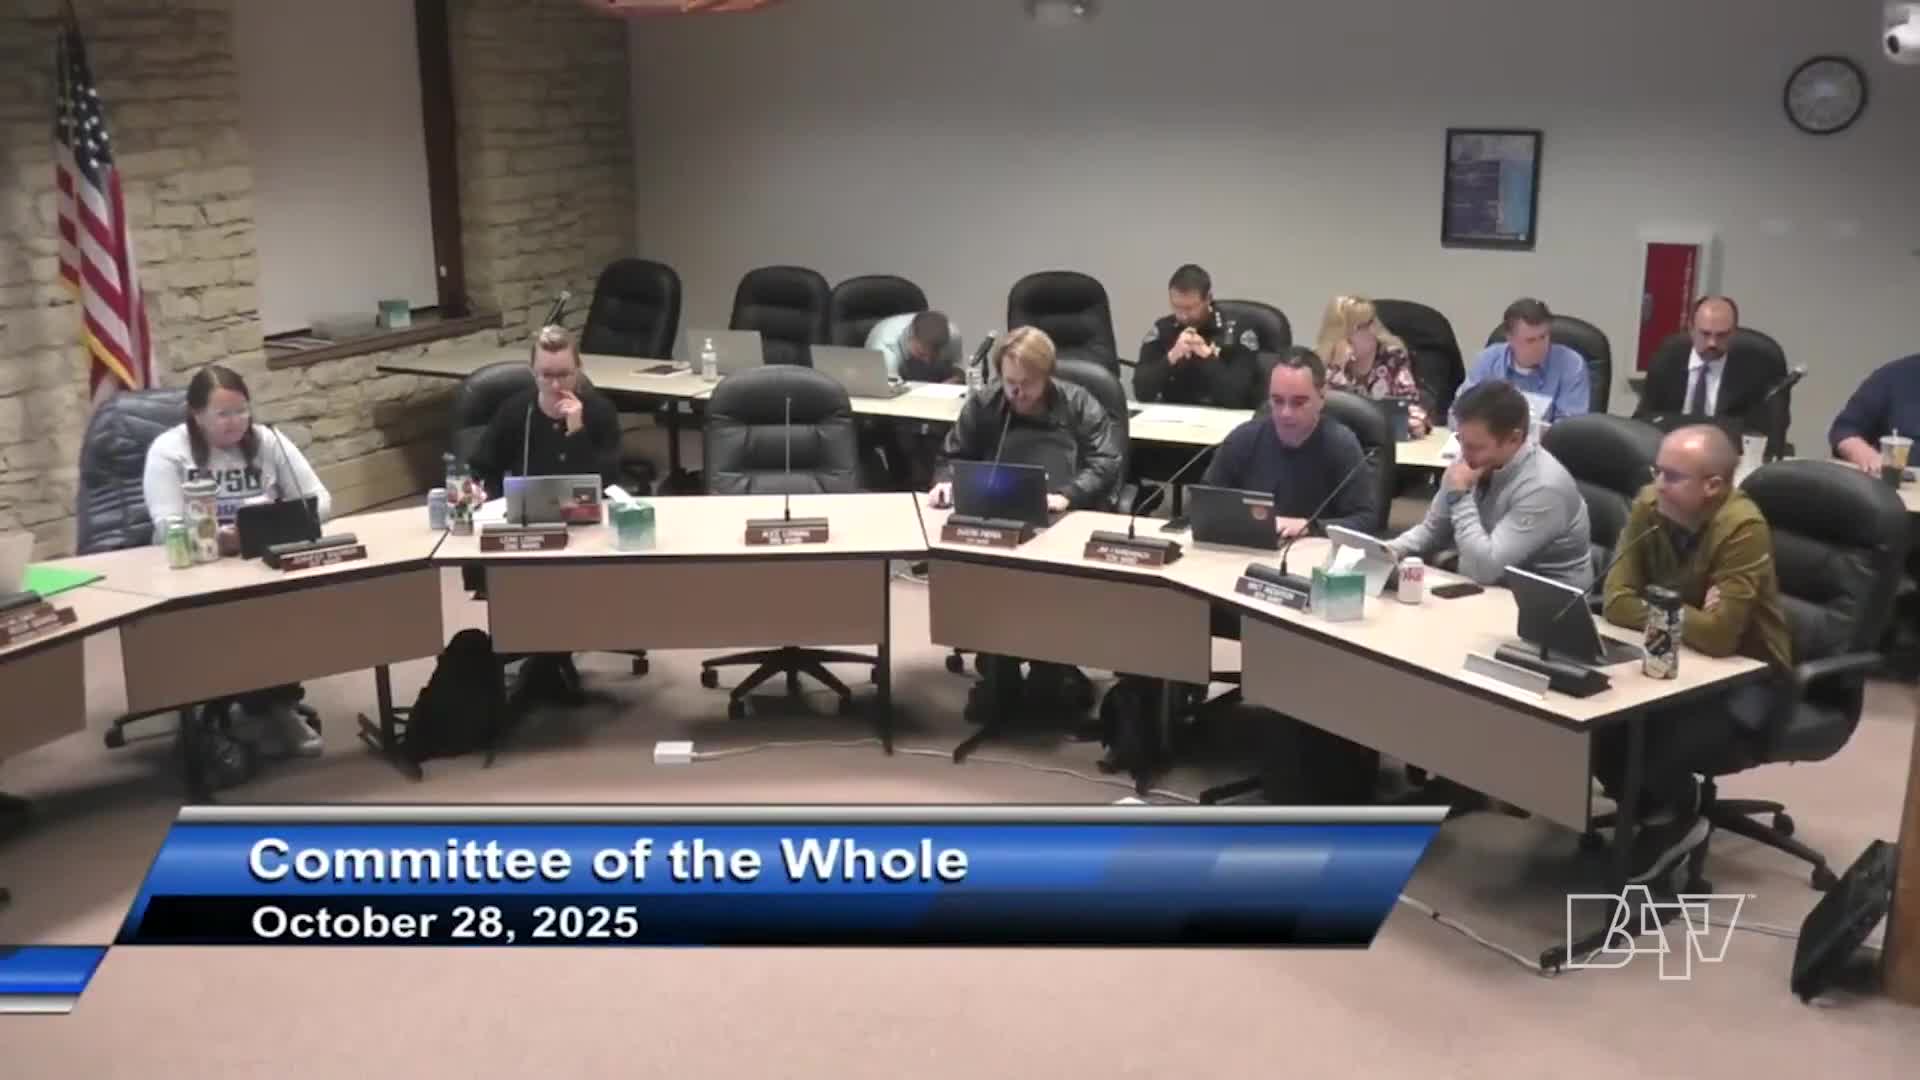
Batavia city staff presented an interactive downtown occupancy dashboard to the Committee of the Whole on Oct. 28, showing ground-floor commercial occupancy, partial occupancy and vacant parcels in the downtown mixed-use zone. The presentation — led by Anthony (city staff) with GIS work by Mike Kamen — translated previously paper-based vacancy tallies into a map and filterable charts.
The dashboard highlights three categories on the map: green for fully occupied ground-floor commercial buildings, yellow for partially occupied properties and magenta for vacant properties. It excludes churches and residential uses and focuses on ground-floor commercial square footage. Staff said utility-billing data are used as a proxy to detect changes in occupancy when responsibility for a utility account changes.
City leaders said the dashboard’s initial figures undercut a common perception about downtown vacancy. “Look at the dial. We’re only — it’s at, like, less than 11% of vacancy,” an alderman said, noting Batavia compared favorably with nearby towns. Councilmembers complimented the visual format and asked staff to expand the dashboard’s scope to include: length of vacancy (recent vs. long-term), previous tenant types, total downtown acreage in parking lots or vacant land, and a residential-overlay to show buildings with dwelling units above ground-floor businesses.
Mike Kamen, the GIS staff member who contributed to the project, said those additions are feasible and that the dashboard is intended as a first phase that staff will refine based on council feedback. Staff also said the tool can be adapted to show industry-by-square-footage and tally vacancies by building type.
City staff said the dashboard will be maintained as a live document and that they will circulate screenshots and additional visualizations to council. Additional technical work and requests from aldermen will guide subsequent phases of development.
For now, the dashboard gives Batavia officials a city-produced, parcel-level snapshot of downtown commercial occupancy that staff said will help shape future economic development discussions and targeted outreach to brokers, landlords and prospective tenants.
