State education staff train district leaders to analyze mid‑year Acadience data in ALO
Get AI-powered insights, summaries, and transcripts
Subscribe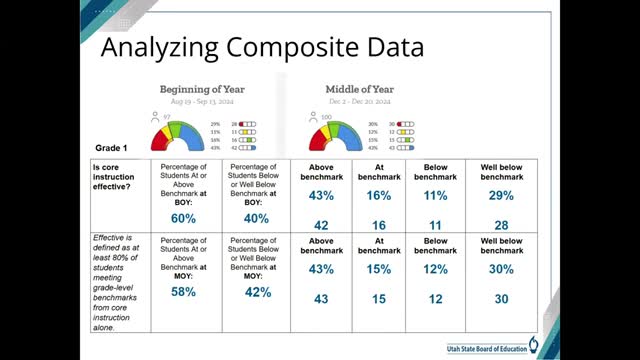
Summary
Utah State Board of Education assessment staff led a virtual training showing district and school users how to use ALO (Acadience Learning Online) to analyze mid‑year Acadience composite scores, effectiveness of instructional supports, and pathways of progress, and gave step‑by‑step instructions for printing and filtering reports.
Theresa McIntyre, Assessment Development Coordinator at the Utah State Board of Education, led a virtual training for district and school staff on analyzing middle‑of‑year Acadience benchmark data using ALO (Acadience Learning Online).
The session explained how to use the composite score, the effectiveness of instructional support report and the Pathways of Progress measures to identify students who need additional support and to evaluate whether core instruction and interventions are moving students toward benchmarks. McIntyre said, “This composite score is the likelihood of success on future benchmarks.”
Why it matters: the presenters said middle‑of‑year data are intended to identify students who need different or additional supports before end‑of‑year assessments, and to inform system‑level decisions about instruction. Jared Ray, Elementary Math and Science Assessment Specialist at the Utah State Board of Education, summarized a guideline emphasized in the training: “If you are moving 80 to a 100% of your below or well below students up and maintaining those at or above benchmark level, then your instruction is effective.”
Presenters walked participants through three primary tools in ALO. The composite score report shows the percent and number of students at well below, below, at, and above benchmark at the beginning and middle of year; the effectiveness of instructional support report tracks cohorts of students (for example, those who were well below at beginning of year) and how they distributed across levels at mid‑year; and the Pathways of Progress column (the “fans” or pathway filters) shows growth categories and is used to calculate the percent of students making typical or better progress.
Practical instructions given to participants included: open ALO, select the “A” (main dashboard) then Students and the green dropdown to choose Benchmark Overview; use the browser Print function to save the benchmark overview as a PDF (the PDF prints percentages and N sizes); use the filter icon (three lines) to limit view to a specific school or grade; and in the student list view use the pathways filter to identify the denominator (all students with a pathway) and the numerator (those with typical or better progress) before dividing to compute percent meeting the growth metric.
Trainers called attention to common causes of mid‑year score changes. McIntyre and Ray noted that assessment design and changes in subtests can affect comparisons between beginning and middle of year. As an example, the presenters said kindergarten and first grade often show large score shifts when different subtests or expectations (such as reading connected text in mid‑first grade) are introduced. McIntyre said that dropoffs at mid‑first grade often indicate students are not spending enough time reading connected text, rather than a failure of the screening tool itself.
The session also emphasized growth‑focused interpretation for different student groups. For students at or above benchmark, typical growth is generally acceptable to maintain proficiency; for students below or well below benchmark, trainers recommended aiming for above‑typical growth so those students begin closing the achievement gap. The presenters noted one state threshold currently used for math: 60% of students in grades 1–3 should achieve typical or better growth (the trainers said a literacy growth target was removed after board rule changes).
Participants asked technical and calculation questions during the session (for example, how to isolate a grade, how the ALO hover vs. print displays N sizes, and whether to exclude students without a beginning‑of‑year score). Trainers advised excluding students who lack a beginning‑of‑year score when calculating pathways percentages and reiterated that ALO’s pathway filter removes students with no pathway.
The training concluded with guidance for next steps: presenters asked district and school staff to finish the composite/effectiveness/pathways analyses after the session, discuss findings with classroom teachers, dive to the individual student level where needed, and use the mid‑year window to change trajectories for students not making sufficient growth. McIntyre closed by sharing slide resources and a post‑session form for certificates and continuing‑education credits.
Attendees included multiple district and school staff who asked questions about ALO navigation and interpretation; presenters and several participants demonstrated printing, filtering and reading cohort distributions in real time.