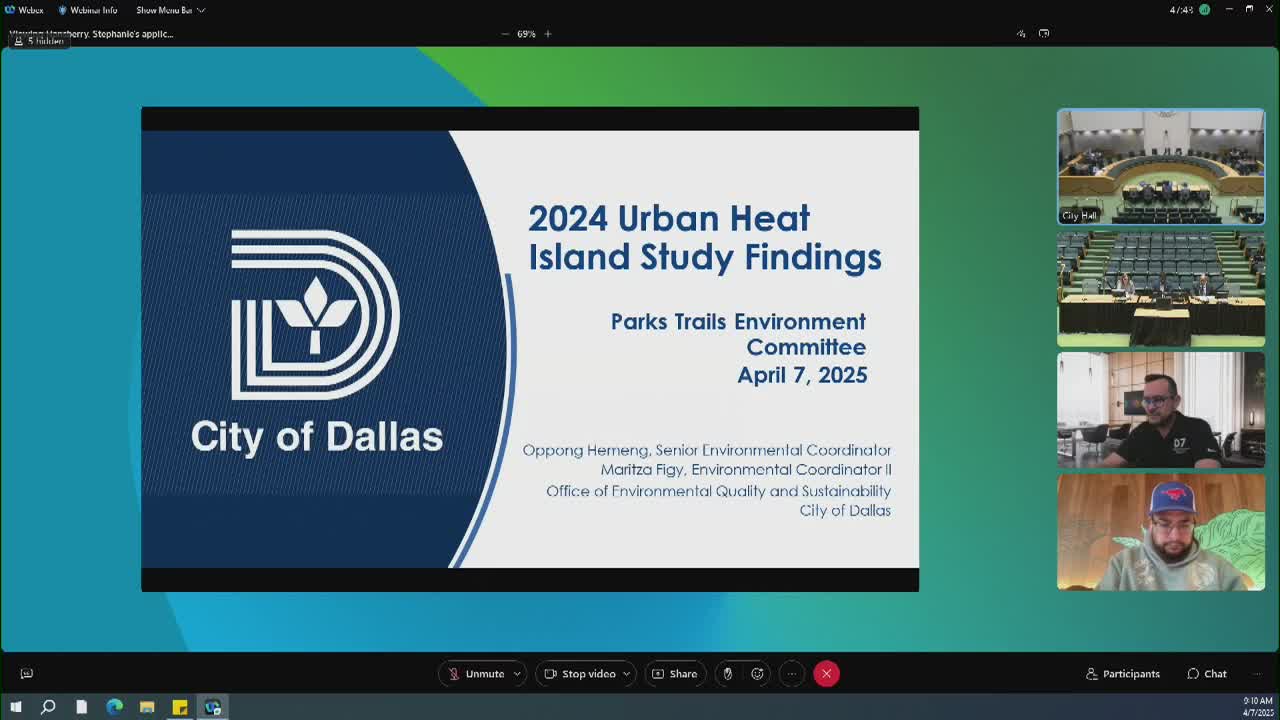
Dallas study identifies hot spots; OEQS urges using maps for cooling and outreach
Get AI-powered insights, summaries, and transcripts
Subscribe
Summary
City Office of Environmental Quality and Sustainability staff presented combined 2023–24 urban heat island mapping showing up to a 12-degree difference across neighborhoods, highlighted hot zones around downtown and I‑35 corridors, and proposed using maps to prioritize tree planting, cooling shelters and heat-response planning.
The Office of Environmental Quality and Sustainability presented on an expanded urban heat island study and interactive maps showing concentrated heat in parts of Dallas and proposed next steps to guide tree planting and heat-response planning.
The study’s purpose, Paul White, Director, Office of Environmental Quality and Sustainability, said, was “to identify the hot spots in our city and prepare for extreme heat” and to help prioritize “ways to implement cooling solutions in the communities.”
The study combined vehicle-based temperature data collected in 2023 and 2024 and modeled citywide surface temperatures. OEQS staff said they covered the entire city — “100% of the city, which is about 350 square land miles” — with three one‑hour driving sampling sessions per day during data collection runs. The team reported a maximum simultaneous temperature differential of about 12 degrees, meaning one location could be around 90°F while another reached roughly 102°F at the same time.
The combined map shows the highest modeled heat concentrated in the northwest quadrant of the city, downtown and adjacent industrial areas and along the I‑35 corridor. Cooler conditions appeared near the Trinity River and within the Great Trinity Forest, where canopy cover helped moderate temperatures. The presentation noted built infrastructure such as highways, shopping areas and surface parking concentrated heat, while street trees and pocket parks reduced it.
OEQS staff described interactive map features that allow users to view morning, afternoon and evening readings, inspect individual temperature points recorded every second during a one‑hour drive session, and visualize routes used to create the model. White said staff are working with consultants and internal IT partners to host the maps on city servers so departments can layer planning and council‑district information onto the heat data.
Committee members asked for greater geographic clarity and community access. Chair Arnold pressed staff to ensure neighborhood labels were precise, saying, “We do need to be very clear about that because we wanna make sure we get justice.” Assistant City Manager Liz Cedillo Pereira and OEQS staff offered to provide a more detailed walkthrough of the interactive map and promised to brief councilmembers and their staff on site‑specific hot spots.
Council members discussed next steps for using the data: integrating it into tree‑planting strategies with Parks and Recreation, feeding it into emergency and heat‑response planning with Dallas Fire and Rescue and the Office of Emergency Management, and offering the maps to Public Works and homelessness services for siting cooling shelters and inclement weather centers. White said OEQS also hopes to incorporate the findings into weatherization projects, budget permitting, and to continue public outreach so residents know the data are available.
Members raised use and interpretation issues: one member noted data collection occurred on a Saturday and asked whether weekday traffic and transit patterns could change results; another asked staff to identify areas that are “teetering” from moderate to high heat so neighborhoods can take preventive measures such as preserving canopy cover. OEQS staff said the maps can be layered with additional data — for example, tree canopy inventories — to support proactive planning.
The committee did not take formal action at the briefing. Staff were directed to provide councilmembers and the public clearer, more granular access to the interactive map and to coordinate further with Parks, Dallas Fire and Rescue, Public Works, homelessness services and the city’s planning teams to inform tree‑planting and heat‑response measures.
The presentation and committee discussion focused on translating the mapping into operational uses — targeting canopy expansion, siting cooling centers and informing neighborhood outreach — rather than proposing new regulations or specific budget actions at this meeting.
OEQS staff said they will return with additional briefings and are available to walk council offices through the map to identify district‑level hot spots for targeted outreach and interventions.
