State dashboard shows Black and Hispanic veterinarians underrepresented; data covers three‑quarters of licenses
Get AI-powered insights, summaries, and transcripts
Subscribe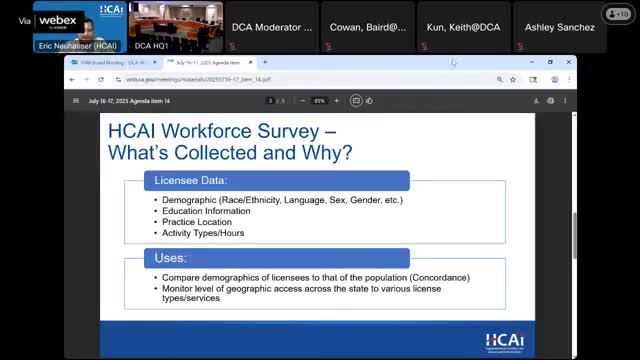
Summary
The Department of Health Care Access and Information presented a renewal‑survey dashboard to the California Veterinary Medical Board showing 76.5% coverage of veterinary licensees, a 12.1% or lower “decline to state” rate on items, and notable underrepresentation of Black and Hispanic licensees statewide and by county.
The California Department of Health Care Access and Information (HCAI) presented workforce data to the California Veterinary Medical Board on demographic and practice characteristics collected during online license renewals. Elise Ram of HCAI said the dashboard is built from renewal questions and intends to support workforce planning across license types.
The dashboard matters because it gives regulators and researchers a statewide—and county—view of who is practicing veterinary medicine and where. That information can help identify gaps in access to veterinary services.
HCAI officials told the board the data source is a renewal‑period survey created after AB 133 amended Business and Professions Code Section 502 and Health and Safety Code provisions to require healing‑arts licensing boards to collect workforce data. “We did note that Black and African Americans and Hispanics are the most underrepresented groups in the statewide veterinary workforce,” Ram said. She added that representation “does seem to be present for both groups in nearly every county that had licensees identifying as Black or Hispanic.”
Ram demonstrated the dashboard’s features: county‑level concordance scores (how similar licensee demographics are to local population), filters by license type and age cohort, and drilldowns for ethnicity detail inside broader race/ethnicity categories. She told the board HCAI has survey coverage for “76.5% of all of our veterinary licenses across the state” and reported a decline‑to‑state rate of about “12.1% or less depending on which survey item we’re looking at.” Ram also said the tool can help map geographic “veterinary deserts.”
Board members asked whether HCAI could compare veterinary data with human medical license data; HCAI replied that such comparisons are possible if the board defines the question. The agency also said it will provide the dashboard and underlying open data to the Department of Consumer Affairs (DCA) for publication on the DCA web site.
HCAI staff offered follow‑up help to board members who want deeper demonstrations or additional dashboards (languages spoken and education pathways are in development). The presentation closed with HCAI inviting questions and offering to follow up on the DCA publication timeline.